
https://www.snackvideo.com/video/...Fetching video...
For personal use only. Please respect the creator's work.
Snack Video Downloader – Easily Download Videos Without Watermarks
Introduction
Short-form video apps are becoming increasingly popular, and Snack Video is one of the top platforms enjoyed by users every day. Many people want to save their favorite videos, but often face issues like watermarks or the need to install additional apps.
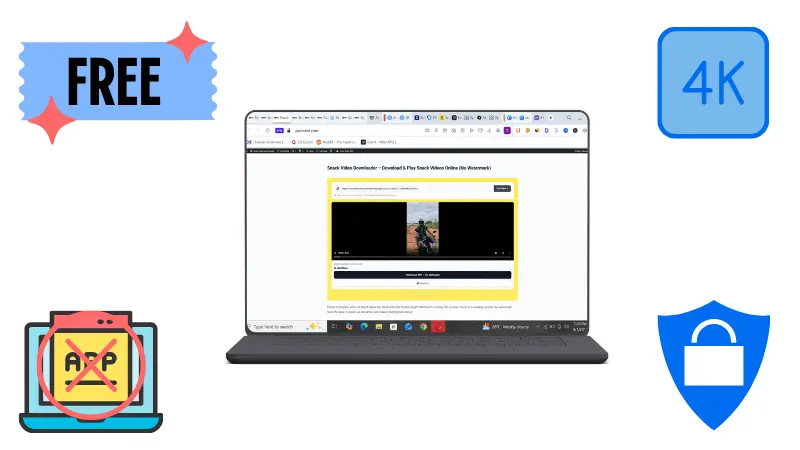
In this guide, we’ll show you a simple and quick way to download Snack videos without watermarks using a reliable Snack Video Downloader—no app required, and in HD quality.
What is the Snack Video Downloader?
The Snack Video Downloader is an online tool that allows you to:
- Download Snack videos instantly
- Save videos without watermarks
- Use it directly from your browser (no app required)
👉 It’s very easy to use, and we’ve made it simple so anyone can use it without any confusion.
Why Do People Download Snack Videos?
People download videos for a simple reason:
- To watch videos offline
- To share with friends and family
- Saving favorite content
- Editing or reusing videos (for personal use)
Step-by-Step Guide: How to Download Snack Video
Step 1: Open Snack Video
Open the Snack Video app or website, then select the video you want to download.
Step 2: Copy the Video Link
Click the “Share” button and select the Copy Link option.

Step 3: Open the Snack Video Downloader
Visit our homepage where the downloader is available.
Step 4: Paste the Link
Paste the copied link into the input box.
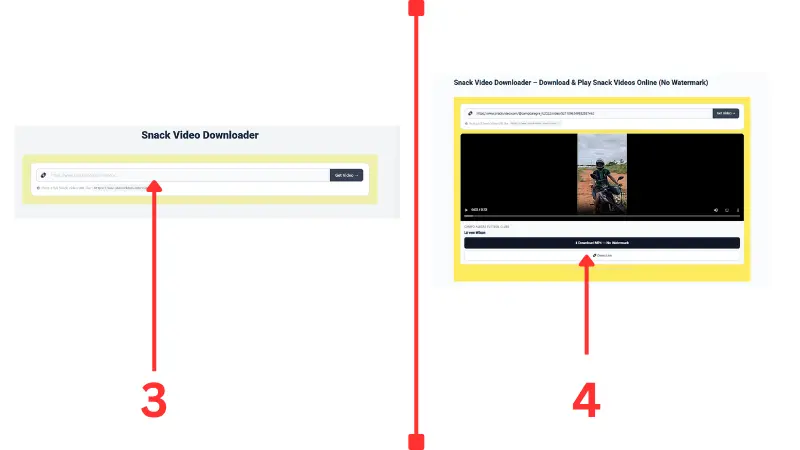
Step 5: Preview or Play the Video (Important)
Before downloading, play or preview the video to make sure it’s the right one.
👉 If you don’t want a watermark, select the watermark-free option.
👉 If you prefer the original version, use the direct link option (with watermark).
Step 6: Click the Download Button
Click the download button and save the video to your device.
Snack Video Downloader Features
| Features | Details |
|---|---|
| No Watermark | Download videos without watermarks |
| HD Quality | Supports high-quality video downloads |
| High Speed | Download videos in seconds |
| No App Required | Works directly in your browser |
| Free Tool | Completely free to use |
| Preview Option | Play and preview the video before downloading |
Device Compatibility (Works on All Devices)
| Devices | Support | Details |
|---|---|---|
| Android | ✅ Yes | Works smoothly in mobile browsers |
| iPhone | ✅ Yes | Use Safari or Chrome |
| PC | ✅ Yes | All features available |
| Mac | ✅ Yes | Works on all modern browsers |
| Tablet | ✅ Yes | Same experience as on a phone |
👉 No matter what device you use, we ensure this downloader works smoothly without any issues.
Is Snack Video Blocked? (Solution)
In some countries, Snack Video may be blocked, so you can’t access the app or website.
🔓 What’s the solution?
👉 You can easily access it using a VPN.
Steps:
- Install a VPN on your phone or browser
- Connect to a supported country (such as the UAE, Indonesia, etc.)
- Open the Snack Video app or website
- Copy the video link and use a downloader
👉 This way, you can still download videos even in restricted regions.
Is the Snack Video Downloader Safe?
Yes, it’s safe if you use a trusted website.
👉 We recommend following these simple tips:
- Avoid installing unknown apps
- Use only trusted online tools
- Don’t share personal information
SEO Tips (Useful for Users)
👉 For the best experience, we recommend:
- Use a stable internet connection
- Always keep your browser up to date
- Use a fast internet connection for HD downloads
Common Issues and Solutions
❌ Video Not Downloading
✔ Make sure the link is correct
✔ Check your internet connection
❌ Slow Download Speed
✔ Check your internet
speed ✔ Close apps running in the background
❌ Watermark Not Removed
✔ Try another option
✔ Use the updated tool
Additional Features (Download Thumbnails & MP3s)
If you want to download thumbnails (cover images) or audio (MP3) from Snack videos, you can use additional tools.
👉 For thumbnails and audio, you can use tools like getsnackvideo.
Benefits of This Feature:
- Easily save video thumbnails
- Download audio in MP3 format
- Useful for content creators
👉 This feature is best suited for users who want more than just videos.
Conclusion
The Snack Video Downloader is a simple yet powerful tool that helps you quickly and easily download watermark-free Snack videos. Just copy the link, paste it, preview it, and download it in seconds.
👉 If you’re looking for a quick and easy solution, we’re confident this is the best choice.
👉 “Try the Indonesian version now and download your favorite Snack videos instantly!”
FAQ (Frequently Asked Questions)
Is Snack Video Downloader free?
Yes, most tools are completely free to use.
Can I download Snack videos without an app?
Yes, you can download videos directly using your browser.
Can I remove the watermark?
Some tools allow watermark removal, depending on the video.
Does it work on mobile and desktop?
Yes, it works on all devices.
Do I need to create an account?
No, there is no need to sign up or create an account.